
As businesses and organizations continue to evolve, so do the ways in which they collect and utilize data. One powerful tool that has become increasingly popular is a Computerized Maintenance Management System (CMMS). A CMMS is a software program designed to help organizations manage and track maintenance operations. It can be used to schedule and monitor preventative maintenance tasks, create work orders, track inventory, and more. However, one of the often-overlooked benefits of using a CMMS is its ability to generate reports and visualize data.
Here are some of the benefits of using a CMMS for reporting and data visualization:
- Improved Decision-Making: A CMMS can provide managers and decision-makers with valuable data that can be used to make informed decisions. With the help of a CMMS, you can create customized reports that provide insights into maintenance operations, such as equipment downtime, repair costs, and inventory levels. By having access to this information, managers can make data-driven decisions that can help reduce costs and improve efficiency.
- Real-time Reporting: With a CMMS, data can be updated in real-time, providing up-to-date information that can be used for decision-making. Real-time reporting can help managers make informed decisions quickly and take immediate action to address any issues.
- Increased Productivity: By using a CMMS to generate reports, employees can spend less time manually compiling data and more time focused on their core responsibilities. A CMMS can automate the report generation process, saving valuable time and increasing productivity.
- Improved Communication: CMMS reports can be shared with different departments and stakeholders, allowing for improved communication across the organization. Reports can be customized to provide relevant information to specific departments, making it easier for them to collaborate and work together.
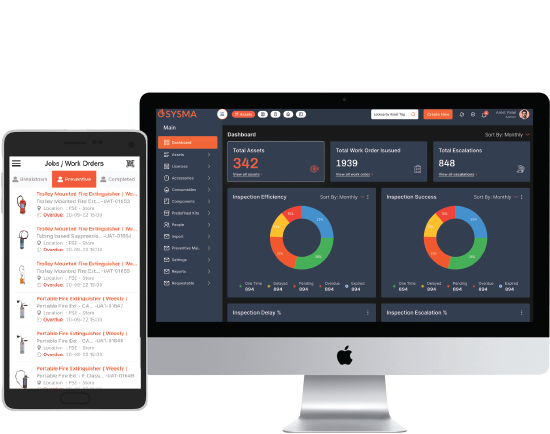
- Data Visualization: One of the most significant benefits of using a CMMS for reporting is the ability to visualize data. CMMS reports can be presented in a variety of formats, such as charts, graphs, and tables, making it easier to understand complex data. Visualizations can help identify trends and patterns, making it easier to spot areas that need improvement.
- Predictive Maintenance: With the help of a CMMS, you can use data to predict equipment failures and maintenance needs. By analyzing historical data, a CMMS can identify patterns that may indicate potential equipment failures. This can help you proactively schedule maintenance tasks, reducing downtime and repair costs.
In conclusion, a CMMS can be a powerful tool for organizations looking to improve their maintenance operations. By using a CMMS for reporting and data visualization, organizations can make informed decisions, improve productivity, and reduce costs. The ability to visualize data can help identify trends and patterns, making it easier to spot areas that need improvement. With the help of a CMMS, organizations can achieve better maintenance outcomes, leading to improved operational efficiency and increased profitability.